
This is an old revision of the document!
Multiscale models
Coupling spatial models: Autocrine chemotaxis
Introduction
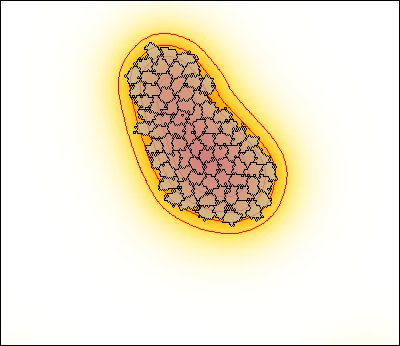
This example models a cellular Potts model for autocrine chemotaxis by coupling a CPM to a diffusive chemoattractant.
Model description
It exemplifies the combination of a CPM with a PDE through the chemotaxis towards a diffusive chemoattractant produced by cells. The CellType has a Property p (production rate) which is positive within biological cells, and is zero in the medium 'cell type'. The symbol p can than be used in the PDE as the production term for species or Layer U. In this way, U is produced in each lattice node that is occupied by a cell, and is not produced outside of cells. At the same time, cells perform Chemotaxis towards the chemoattractant U.
The simulation is visualized using some advances Gnuplotter feature. Cells are superimposed on the PDE and appear as transparent domains (see opacity). Moreover, the concentration gradient of the PDE is emphasized by the use of isolines that draws contours as positions with equal concentration.
Model
h AutocrineChemotaxis.xml |h
extern>
http://imc.zih.tu-dresden.de/morpheus/examples/Multiscale/AutocrineChemotaxis.xml
Examples → Multiscale → AutocrineChemotaxis.xml
Coupling CPM and PDE: Vascular patterning
Introduction
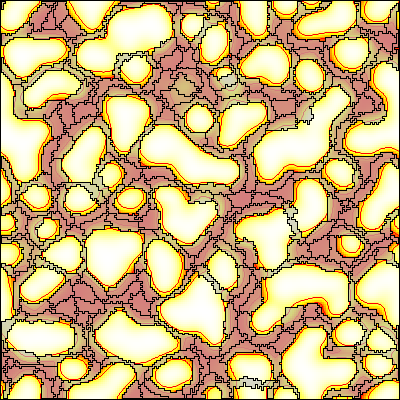
This example shows a model of vascular network formation by paracrine signaling (Köhn-Luque et al., 2011) and employs a coupled CPM and reaction-diffusion model.
Model description
The model defines a CPM as well as a PDE. These models are coupled by two processes:
- Cells, specified in
CellTypes, respond chemotactically to aLayer(or species) in thePDE - Conversely, the production term of one
PDE Layeris coupled to the presence/absence of cell.
Model
h VascularPatterning.xml |h
extern>http://imc.zih.tu-dresden.de/morpheus/examples/Multiscale/VascularPatterning.xml
Examples → Multiscale → VascularPatterning.xml
Reference
Köhn-Luque A, de Back W, Starruß J, Mattiotti A, Deutsch A, et al. Early Embryonic Vascular Patterning by Matrix-Mediated Paracrine Signalling: A Mathematical Model Study. PLoS ONE 6(9): e24175, 2011
ODEs in CPM cells: Cell cycle and proliferation

Introduction
This multiscale model example shows
- how to define a coupled system of continuous ODEs in discrete CPM cells
- how to specify and change time scales between these model formalisms
Model description
This model specifies an oscillatory ODE model representing the cell cycle in Xenopus oocytes using three components (CDK1, Plk1, APK) (Ferrell et al., Cell, 2011) (see CellTypes→CellType→System). This ODE model is coupled to 2D shaped CPM cells that perform divide based on the concentration of these components (see CellTypes→CellType→Proliferation→Condition). As in the early Xenopus cell cleavage, this leads to exponential growth of the number of cells, without increase of total cell volume.
Time scales
Time scales are defined in the following fashion:
- The so-called global time scheme is defined in
Timeand here runs from0to1arbitrary time units. All models and plugins specify their updating scheme in terms this global time scheme (e.g.Analysis→Gnuplotter→interval).
- The CPM time scale for cell motility and behaviors is defined in
CPM→MCSDuration. This specifies the time that a single Monte Carlo step in the CPM lasts, in terms of the 'global time'. Here, theMCSDurationis $1.0\cdot10^{-4}$ which means the CPM is executed 10.000 times during this simulation.
- For setting time of ODEs, one has to distinguish the (1) how often the ODEs are evaluated from (2) controlling the time scale of the ODE dynamics:
- The time scale of the ODE dynamics can be changed using
System→time-scaling. When larger or smaller than $1.0$, this speeds up or slows down make the dynamics, without influencing the accuracy of the approximation. - The accuracy of the numerical approximation (and is equal to the $\Delta t$ of the numerical solver) is controlled using
System→time-step(and is automatically rescaled according to the time scale).
Things to try
- Change the CPM time scale, relative to the ODE dynamics: Change
CPM→MCSDurationto $1.0\cdot10^{-3}$ or decrease to $1.0\cdot10^{-5}$. This makes cells to have less resp. more motility/relaxation in between cell divisions.
- Change the time scale of the ODE dynamics, relative to the CPM by altering
System→time-scaling.
Model
h CellCycle.xml |h
extern>
http://imc.zih.tu-dresden.de/morpheus/examples/Multiscale/CellCycle.xml
Examples → Multiscale → CellCycle.xml
Dictyostelium

Introduction
This model show chemotactic aggregation of Dictyostelium. It was constructed by students attending the ECMI modeling week 2012 in Dresden.
Model description
This model shows an interesting coupling between CPM cells and reaction-diffusion PDE. Cell state depends on the perceived concentration of cAMP, and determines whether a cell produces cAMP and whether it performs chemotaxis. The PDE is governed by a Fitzhugh-Nagumo-like model of an excitable medium, which causes traveling waves upon excitation. Chemotaxis through those waves causes cell aggregation.
Background colors indicate the cAMP concentration. Cells are color-coded according to their phase: excitable/resting (yellow), excited/chemotactic (green), refractory/resting (red).
Model
h Dictyostelium.xml |h
extern>
http://imc.zih.tu-dresden.de/morpheus/examples/Multiscale/Dictyostelium.xml
Examples → Multiscale → Dictyostelium.xml
References
- Rost F, Quintero A, Myllykoski M, Igolkina A, Rohde O’Sullivan Freltoft A, Dixit N, Morphogenesis and Dynamics of Multicellular Systems. ECMI Newsletter, 52, 2012.
- Savill N and Hogeweg P. Modelling morphogenesis: from single cells to crawling slugs. J. Theor. Biol, 184:229–235, 1997.
MembraneProperties: Cell polarization and chemotaxis
Note: MembraneProperties are not available in public version of Morpheus.

Introduction
This model of cell polarity shows the coupling of three model formalisms:
- A cellular Potts model
- A PDE model, solved on the membrane of the cell
- And an external gradient.
The cell membrane polarizes in response to the external gradient. Chemotactic cell motility depends on the polarity of the cell and the external gradient.
Description
This example implements two models of cell polarity: Meinhardt's substrate-depletion model and Edelstein-Keshet's wave-pinning model. The user can switch polarity model by Disabling/Enabling the relevant System.
The model defines a one-dimensional reaction-diffusion system (MembraneProperty) representing membrane-bound molecules, and is mapped to a cellular Potts model defining a discrete shaped cell. An external gradient, specified in a PDE, provides a signal for the polarization of the cell. In turn, the polarity of the cell influences its chemotaxic behavior.
After a switch in direction of the gradient, the cell re-polarizes in the new direction and starts to move up the gradient, iff the wave pinning model has been selected.
Model
h CellPolarity.xml |h
extern>
http://imc.zih.tu-dresden.de/morpheus/examples/Multiscale/CellPolarity.xml