This is an old revision of the document!
Ordinary differential equation models
ODE model: Cell cycle
Introduction
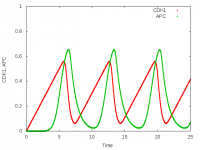
This model is a simple three-species ODE model of the Xenopus embryonic cell cycle (Ferrell et al., 2011). It exhibits sustained limit cycle oscillations.
Model description
One CellType is created that has three variables of Properties representing the concentrations of APC, Plk1, and CDK1. These variables are coupled in a System of DiffEqns.
In the System, a number of Constants are defined whose symbols are used in the DiffEqn. Note that the equations are entered in simple plain text.
The System uses the runga-kutta (4th order) solver for the differential equations and speficies a particular time step (here $ht = 10^{-2}$) which is interpreted in global time steps.
The global time is defined in the Time element and runs from StartTime to StopTime ($0 - 25$). In this non-spatial model, Space defines a Lattice of size $(x,y,z)=(1,0,0)$.
Results are written to a file using the Analysis plugin Logger. The Logger also visualizes the time plot to screen (in “interactive” mode) or to PNG files (in “local” mode).
Things to try
- Change the dynamics by altering
System/time-scaling.
Model
h CellCycle.xml |h
extern>http://imc.zih.tu-dresden.de/morpheus/examples/ODE/CellCycle.xml
In Morpheus GUI:
Examples → ODE → CellCycle.xml.
Reference
Ferrell JE Jr, Tsai TY, Yang Q. Modeling the cell cycle: why do certain circuits oscillate? Cell, 18:144(6), 2011.
SBML import: MAPK signaling
Introduction
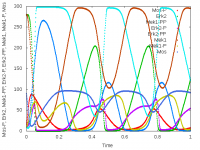
This model has been imported and converted from SBML format. It shows oscillations in the MAPK signaling cascade (Kholodenko, 2000).
Model description
Upon importing an SBML file, a Morpheus model is automatically created. A System of DiffEqns is generated, based on the function and reactions defined in the SBML file and defined as part of a CellType. Additionally, a Logger is generated to record and visualize the output.
Simulation details, such as StartTime and StopTime, as well as the time-step of System, need to be specified manually.
Things to try
- Browse the Biomodels database and try importing some SBML models.
Model
Original SBML model:
h BIOMD0000000010.xml |h
extern>http://imc.zih.tu-dresden.de/morpheus/examples/ODE/BIOMD0000000010.xml
Generated Morpheus model:
h MAPK_SBML.xml |h
extern>http://imc.zih.tu-dresden.de/morpheus/examples/ODE/MAPK_SBML.xml
In Morpheus GUI:
Examples → ODE → MAPK_SBML.xml.
Reference
Kholodenko BN. Negative feedback and ultrasensitivity can bring about oscillations in the mitogen-activated protein kinase cascades. Eur. J. Biochem. 2000 Mar; 267(6): 1583-1588
Delay differential equations: Cell cycle
Introduction
This model is a two-species version of the Xenopus embryonic cell cycle shown above, but uses delay differential equations (Ferrell et al., 2011). It exhibits sustained limit cycle oscillations.
Model description
This model uses two Properties (CDK1 and APC) and two DelayProperties (CDK1_d and APC_d) with delay $\tau$. The latter are properties that return the value that has been assigned at time $t-\tau$.
Things to try
- Explore the effect of delays by altering the
DelayProperty/delay.
Model
h CellCycle.xml |h
extern>http://imc.zih.tu-dresden.de/morpheus/examples/ODE/CellCycleDelay.xml
In Morpheus GUI:
Examples → ODE → CellCycle.xml.
Reference
Ferrell JE Jr, Tsai TY, Yang Q. Modeling the cell cycle: why do certain circuits oscillate? Cell, 18:144(6), 2011.
Coupled ODE lattice: Lateral signaling
Introduction
This example model cell fate decisions during early patterning of the pancreas (de Back et al., 2012). The simple gene regulatory network of each cell is coupled to adjacent cells by lateral (juxtacrine) signaling.
Model description
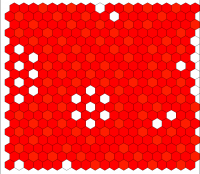
The model defines a lattice of cells with a simplified hexagonal epithelial packing. This is specified in Space using a hexagonal lattice structure of size $(x,y,z)=(20,20,0)$ with periodic boundary conditions. The lattice is filled by seeding it with a Population of $400$ cells.
Each cell has two basic Properties X and Y representing the expression levels of Ngn3 and Ptf1a that are coupled in a System of DiffEqns.
The NeighborsReporter plugin is used to couple the cells to their directly adjacent neighbors. This plugin checks the values of X in neighboring cells and outputs its mean value in Property Xn.
This model uses a number of Analysis plugins:
Gnuplottervisualizes the values of Y with aColorMapthat maps values to colors. It outputs to screen (interactive mode) or to PNG (local mode).Loggerrecords the values of X and Y expression to file and, at the end of simulation, shows a time plot.- The first
HistogramLoggerrecords and plots the distribution of X and Y expression cells over time. - The second
HistogramLoggerrecords and, after simulation, plots the distribution of $\tau$, the time to cell fate decision (see reference).
Model
h LateralSignaling.xml |h
extern>http://imc.zih.tu-dresden.de/morpheus/examples/ODE/LateralSignaling.xml
In Morpheus-GUI:
Examples → ODE → LateralSignaling.xml.
Things to try
- Change the lattice structure from hexagonal to square. See
Space/Lattice. - Change the strength of lateral stabilization
band observe the pattern. SeeCellTypes/CellType/System. - Change the noise amplitude and observe time to cell fate decision ($\tau$).
Reference
W de Back, J X Zhou, L Brusch, On the Role of Lateral Stabilization during Early Patterning in the Pancreas, Journal of the Royal Society Interface, 10:79, 2013.


